Best Time to Visit Svalbard
Monthly figures, seasons and activity months across the archipelago
How the monthly figures are set out
Two sets of monthly figures cover Longyearbyen. The Svalbard Airport Longyearbyen series gives 1991–2020 means for daily maximum, daily mean and daily minimum temperature, along with monthly precipitation, and the airport figures are labelled 1975–2022 averages in the data. The Longyearbyen series gives 1961–1990 averages for the same temperature measures and precipitation, and adds the number of days in each month with at least 1 mm of precipitation. Temperatures are in °C and precipitation is in mm.
Check dates and prices
Airport series by month
| Month | Daily maximum (°C) | Daily mean (°C) | Daily minimum (°C) | Precipitation (mm) |
|---|---|---|---|---|
| January | −7.7 | −10.9 | −14.2 | 21 |
| February | −8.3 | −11.6 | −15.0 | 17 |
| March | −8.8 | −12.0 | −15.5 | 16 |
| April | −5.7 | −8.8 | −12.1 | 9 |
| May | −0.6 | −2.2 | −3.9 | 8 |
| June | 5.6 | 3.6 | 2.2 | 8 |
| July | 9.4 | 7.0 | 5.4 | 20 |
| August | 8.2 | 6.0 | 4.4 | 23 |
| September | 4.0 | 2.0 | 0.3 | 26 |
| October | −1.5 | −3.8 | −6.1 | 18 |
| November | −3.8 | −6.4 | −9.3 | 22 |
| December | −6.1 | −9.2 | −12.2 | 24 |
In January the airport daily mean is −10.9 °C and the daily minimum is −14.2 °C. In July the daily maximum is 9.4 °C and the daily mean is 7.0 °C. Precipitation is 26 mm in September and 23 mm in August, and 8 mm in both May and June.
Svalbard Airport Longyearbyen, monthly daily means
| Item | Value (°C) |
|---|---|
| January | -10.9 |
| February | -11.6 |
| March | -12 |
| April | -8.8 |
| May | -2.2 |
| June | 3.6 |
| July | 7 |
| August | 6 |
| September | 2 |
| October | -3.8 |
| November | -6.4 |
| December | -9.2 |
Longyearbyen series by month
| Month | Daily maximum (°C) | Daily mean (°C) | Daily minimum (°C) | Precipitation (mm) | Days with at least 1 mm |
|---|---|---|---|---|---|
| January | −13.0 | −16.5 | −20.0 | 22.0 | 2 |
| February | −13.0 | −17.0 | −21.0 | 28.0 | 2 |
| March | −13.0 | −16.5 | −20.0 | 29.0 | 2 |
| April | −9.0 | −12.5 | −16.0 | 16.0 | 3 |
| May | −3.0 | −5.0 | −7.0 | 13.0 | 4 |
| June | 3.0 | 1.0 | −1.0 | 18.0 | 13 |
| July | 7.0 | 5.0 | 3.0 | 24.0 | 17 |
| August | 6.0 | 4.0 | 2.0 | 30.0 | 18 |
| September | 1.0 | −1.0 | −3.0 | 25.0 | 14 |
| October | −4.0 | −6.5 | −9.0 | 19.0 | 5 |
| November | −8.0 | −11.0 | −14.0 | 22.0 | 3 |
| December | −11.0 | −14.5 | −18.0 | 25.0 | 3 |
The 1961–1990 series gives a January daily mean of −16.5 °C and a July daily mean of 5.0 °C. Precipitation is 22.0 mm in January and 24.0 mm in July, and July has an average of 17 days with at least 1 mm of precipitation.
Winter months
At the airport, December has a daily maximum of −6.1 °C, a daily mean of −9.2 °C and a daily minimum of −12.2 °C, with 24 mm of precipitation. January has −7.7 °C, −10.9 °C and −14.2 °C, with 21 mm. February has −8.3 °C, −11.6 °C and −15.0 °C, with 17 mm.
In the 1961–1990 series, December, January and February have daily maximums of −11.0 °C, −13.0 °C and −13.0 °C, and daily minimums of −18.0 °C, −20.0 °C and −21.0 °C. Days with at least 1 mm of precipitation number 3 in December, 2 in January and 2 in February, and December precipitation is 25.0 mm. Snow typically covers Longyearbyen from November to March.
Spring months
At the airport, March has a daily maximum of −8.8 °C, a daily mean of −12.0 °C and a daily minimum of −15.5 °C, with 16 mm of precipitation. April has −5.7 °C, −8.8 °C and −12.1 °C, with 9 mm. May has −0.6 °C, −2.2 °C and −3.9 °C, with 8 mm.
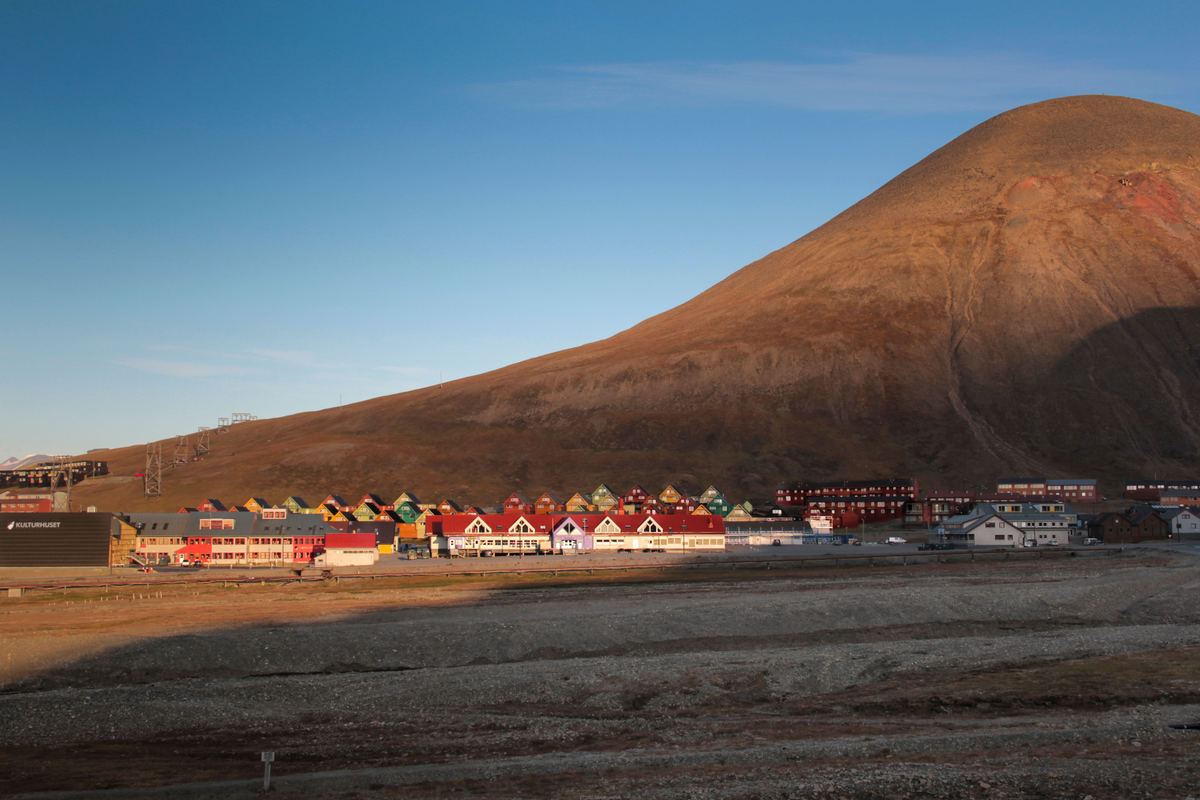
In the 1961–1990 series, March, April and May have daily maximums of −13.0 °C, −9.0 °C and −3.0 °C, and daily means of −16.5 °C, −12.5 °C and −5.0 °C. Days with at least 1 mm of precipitation number 2 in March, 3 in April and 4 in May. The sun is not visible in Longyearbyen until around 8 March, and shading from mountains is given as the reason.
Summer months
At the airport, June has a daily maximum of 5.6 °C, a daily mean of 3.6 °C and a daily minimum of 2.2 °C, with 8 mm of precipitation. July has 9.4 °C, 7.0 °C and 5.4 °C, with 20 mm. August has 8.2 °C, 6.0 °C and 4.4 °C, with 23 mm.
In the 1961–1990 series, June, July and August have daily means of 1.0 °C, 5.0 °C and 4.0 °C, and precipitation of 18.0 mm, 24.0 mm and 30.0 mm. Days with at least 1 mm of precipitation number 13 in June, 17 in July and 18 in August.
Over 1991–2020, the average daily mean summer temperature in Svalbard falls between 4 and 7 °C. The warmest temperature ever recorded in Longyearbyen was 21.7 °C, in July 2020.

Autumn months
At the airport, September has a daily maximum of 4.0 °C, a daily mean of 2.0 °C and a daily minimum of 0.3 °C, with 26 mm of precipitation. October has −1.5 °C, −3.8 °C and −6.1 °C, with 18 mm. November has −3.8 °C, −6.4 °C and −9.3 °C, with 22 mm.
In the 1961–1990 series, September, October and November have daily means of −1.0 °C, −6.5 °C and −11.0 °C, and precipitation of 25.0 mm, 19.0 mm and 22.0 mm. Days with at least 1 mm of precipitation number 14 in September, 5 in October and 3 in November.
Activity months
| Activity or condition | Months | Basis |
|---|---|---|
| Dog sledding trips | Every month of the year | Offered all year round |
| Trips to Barentsburg and Pyramiden | Winter by snowmobile; all year by ship | Snowmobile in winter, ship all year round |
| Snow cover in Longyearbyen | November to March | Typical snow period |
Dog sledding trips are listed for every month of the year. The trip from Longyearbyen to Barentsburg or Pyramiden can be made by snowmobile in winter, or by ship all year round. Tourism activities in Svalbard include hiking, kayaking, glacier cave walks, and snowmobile and dog-sled safaris.
Durations, prices and boat trips
Safaris run for between 4 and 10 hours. A half-day activity is put at between 390 and 1000 NOK, and a full-day activity at between 1000 and 3000 NOK. Pyramiden is 2 to 3 hours by boat across Isfjorden from Longyearbyen. Since the 2024 regulations, ships in protected areas are limited to 200 passengers.
| Item | Figure | Unit |
|---|---|---|
| Safari length | 4 to 10 | hours |
| Half-day activity | 390 to 1000 | NOK |
| Full-day activity | 1000 to 3000 | NOK |
| Boat trip to Pyramiden from Longyearbyen | 2 to 3 | hours |
| Passengers per ship in protected areas | 200 | passengers, under the 2024 regulations |
Rules for visitors
A local recommendation in Longyearbyen covers carrying a rifle for protection against polar bears when going outside the town. Visitors at Pyramiden who are not on a tour group need a hunting rifle for protection. Sightseeing by plane or helicopter is not allowed under environmental laws. The same ship used for the Barentsburg trip goes to Pyramiden on Tuesdays.
Activities in Svalbard
Common questions
What is the January daily mean at Svalbard Airport Longyearbyen?
The airport series gives −10.9 °C as the January daily mean, based on 1991–2020 means.
How much precipitation falls in July?
The airport series gives 20 mm for July, and the 1961–1990 Longyearbyen series gives 24.0 mm.
Can dog sledding trips be taken in any month?
Dog sledding trips are offered across every month of the year.
How long is a safari?
Safaris vary in length from 4 to 10 hours.
What is the warmest temperature recorded in Longyearbyen?
The figure is 21.7 °C, taken in July 2020.
When is the sun first visible in Longyearbyen in spring?
The sun returns to view in Longyearbyen around 8 March, and shading from mountains is given as the reason.
How many days in June have at least 1 mm of precipitation?
Longyearbyen has an average of 13 days in June with at least 1 mm of precipitation, based on 1961–1990 figures.
How long is the boat trip to Pyramiden?
Pyramiden is 2 to 3 hours by boat across Isfjorden from Longyearbyen.